OVERVIEW
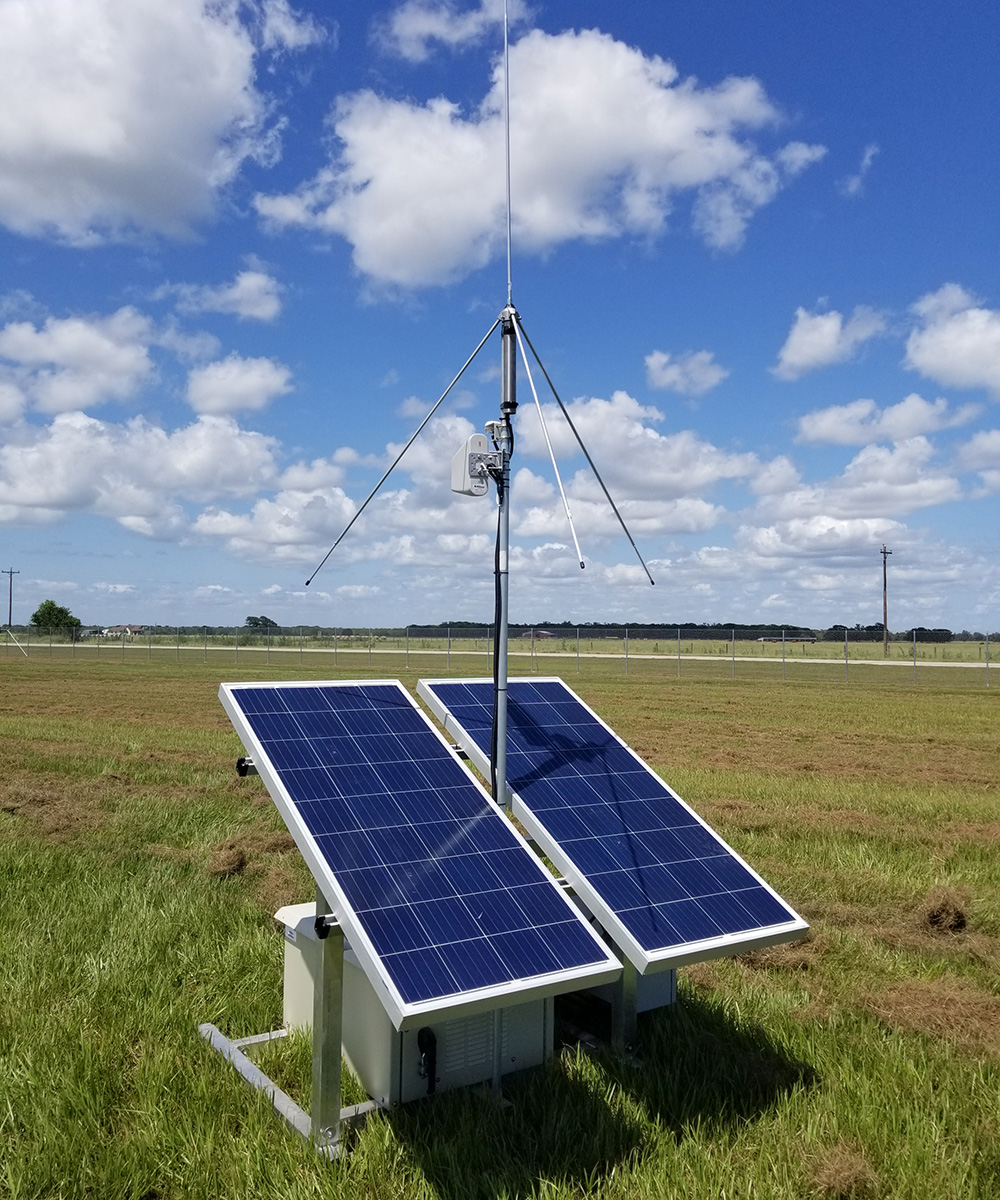
The Houston Lightning Mapping Array (HLMA) network was established in April 2012. It is a surface-based network of twelve sensors which monitor VHF radiation source events from lightning on a locally unused TV channel (e.g., Ch. 3, 60-66 MHz). The sensors utilize a time-of-arrival calculation method which provides 3D lightning information around the Houston Metropolitan area and 2D information to surrounding regions within a 250 km radius of the HLMA network center (which includes the Gulf of Mexico). The VHF source data are grouped into 80 and 400 μs bins which are used for scientific analysis and real-time data web image display.
The primary research goals of the network are to (a) investigate the charge structure of total lightning within thunderstorms as they develop, (b) examine the relationship between electrical activity within deep and shallow convection from continental and tropical systems with respect to precipitation rates, and (c) examine any potential impacts of lightning on urban, coastal, and marine environment and infrastructure. Using lightning to illustrate the rapid intensification (RI) and rapid weakening (RW) of tropical cyclones presents the opportunity for the HLMA network to examine the total lightning structure within tropical cyclones that impact the Texas coast. Hence, deep convective clouds that develop over the Gulf of Mexico can be examined by the magnitude of lightning activity.
HLMA data from major field campaigns and publications can be downloaded from the Texas Data Repository. HLMA data for educational and research purposes can also be requested by contacting Dr. Timothy Logan.

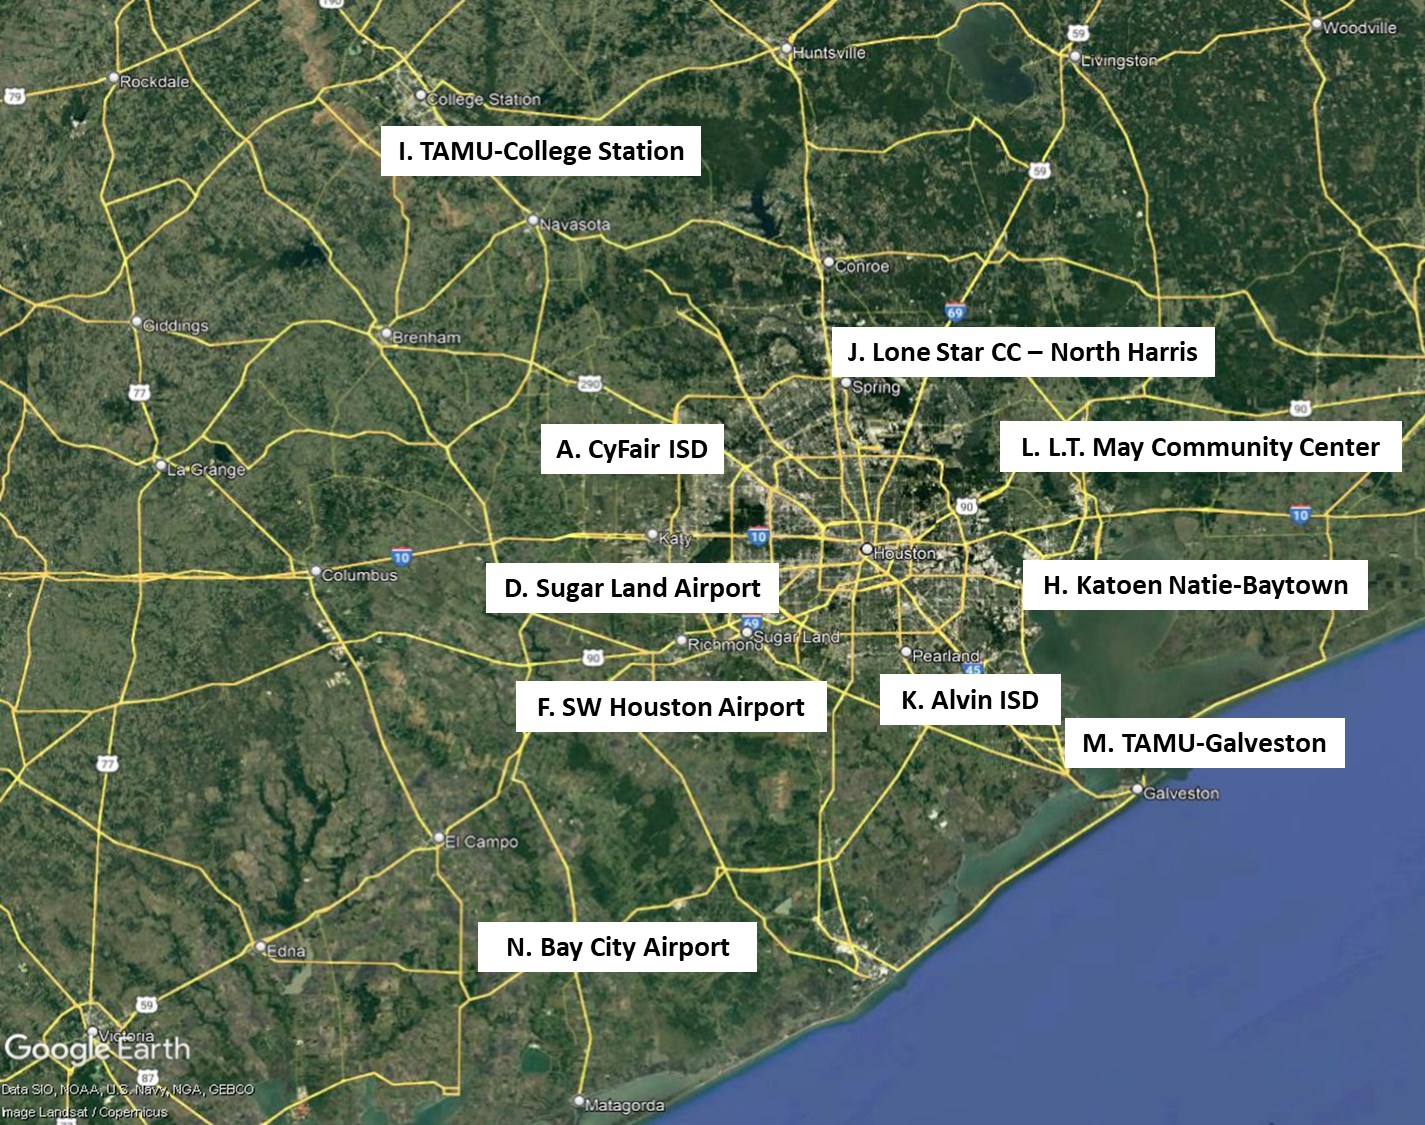
HLMA SITES
A CyFair ISD
D Sugar Land Airport
F Houston SW Airport
H Katoen Natie-Baytown
I TAMU-College Station
J Lone Star Community College - North Harris
K Alvin ISD
L L. T. May Community Center
M TAMU-Galveston
K Bay City Airport
 HOUSTON LIGHTNING MAPPING ARRAY PRODUCTS
USES OF THE 80 MS DATA
- Map a lightning flash from point of initiation to point of strike
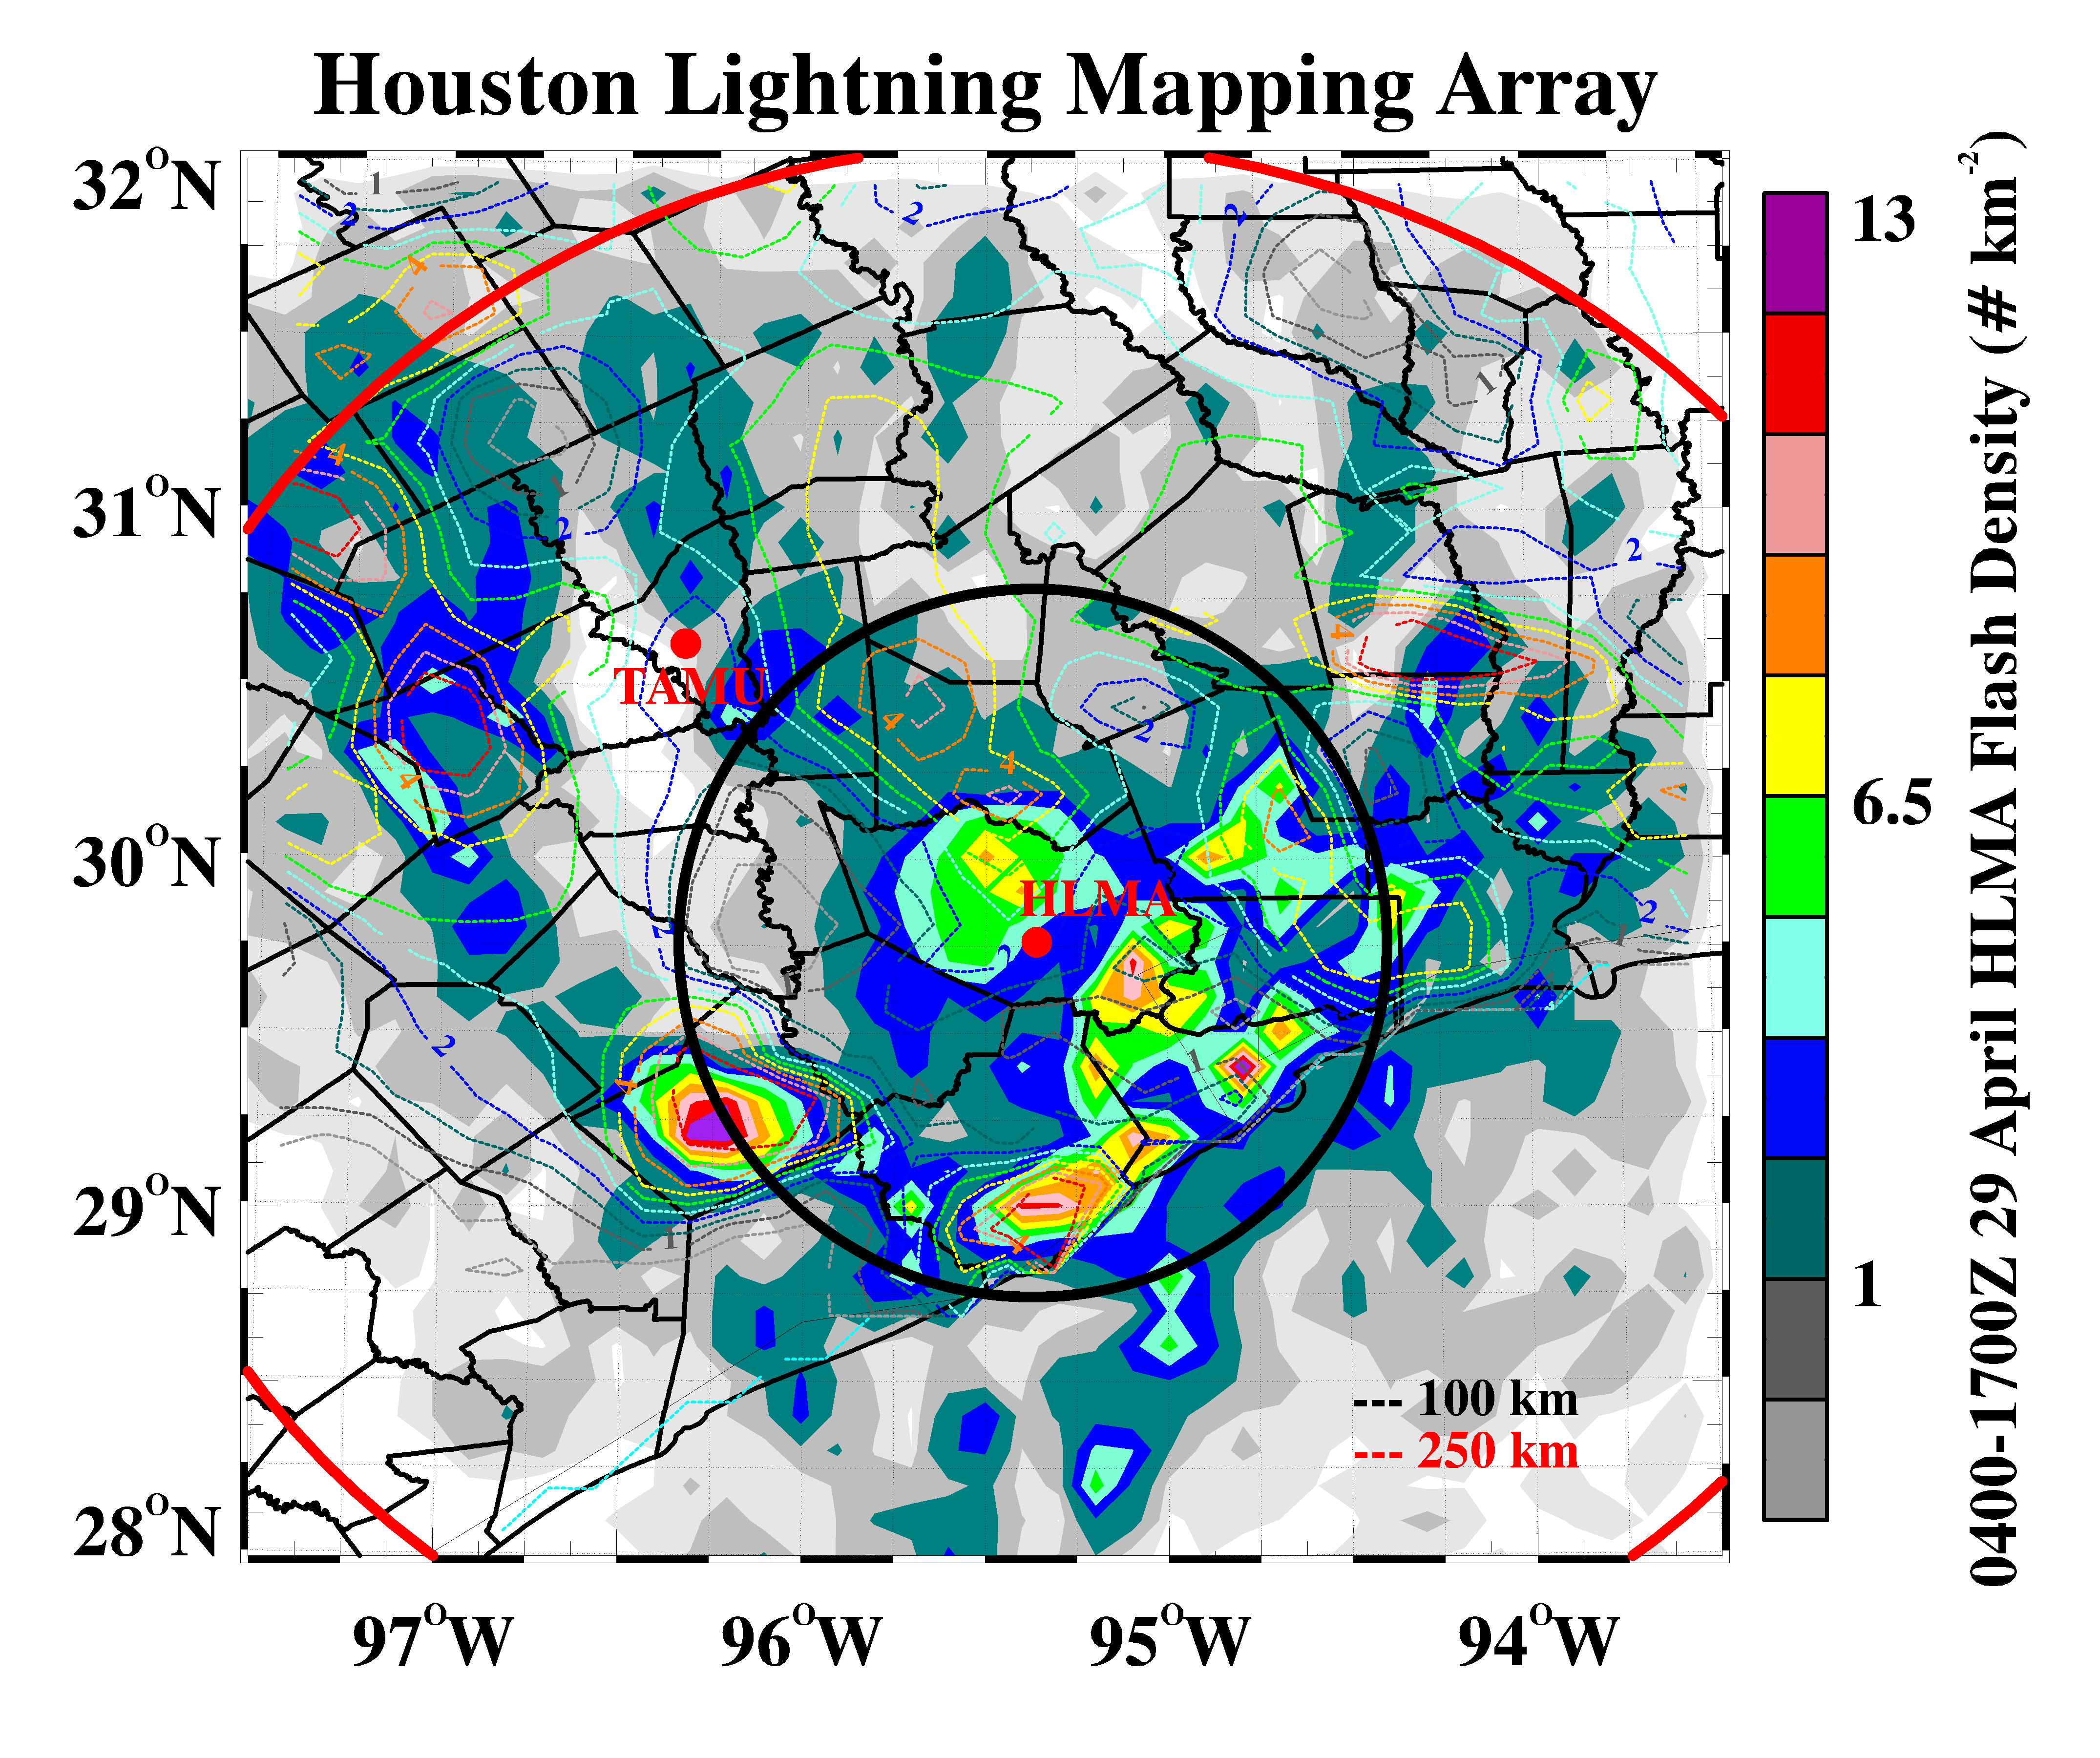
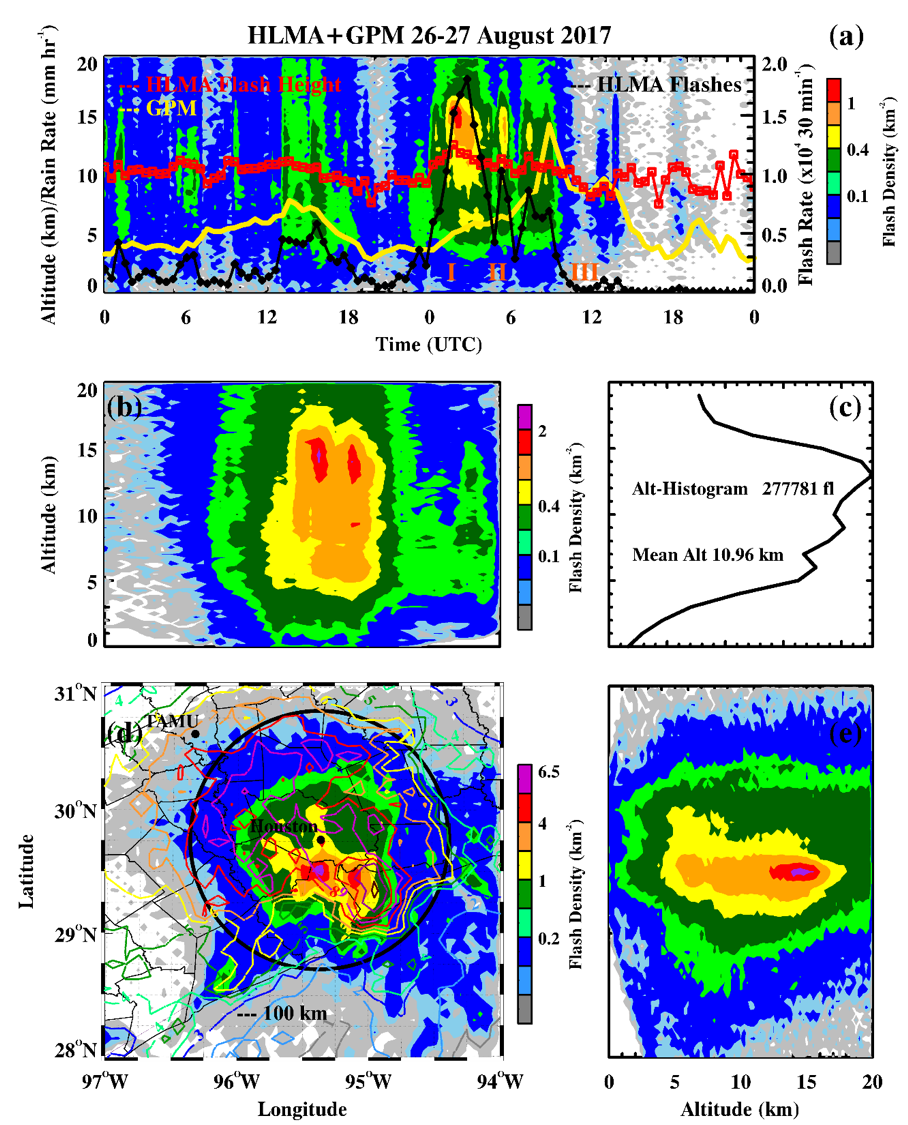
- Visualize lightning flash rates, flash density hotspots, and average flash heights in space and time. In addition, ancillary products such as rain rate can be overlain to show the relationship between lightning activity and precipitation intensity.
- During Tropical Storm Harvey, the height of lightning activity occurred during the overnight hours of August 26, 2017. The most intense flooding was observed several hours later during the morning of August 27, 2017.
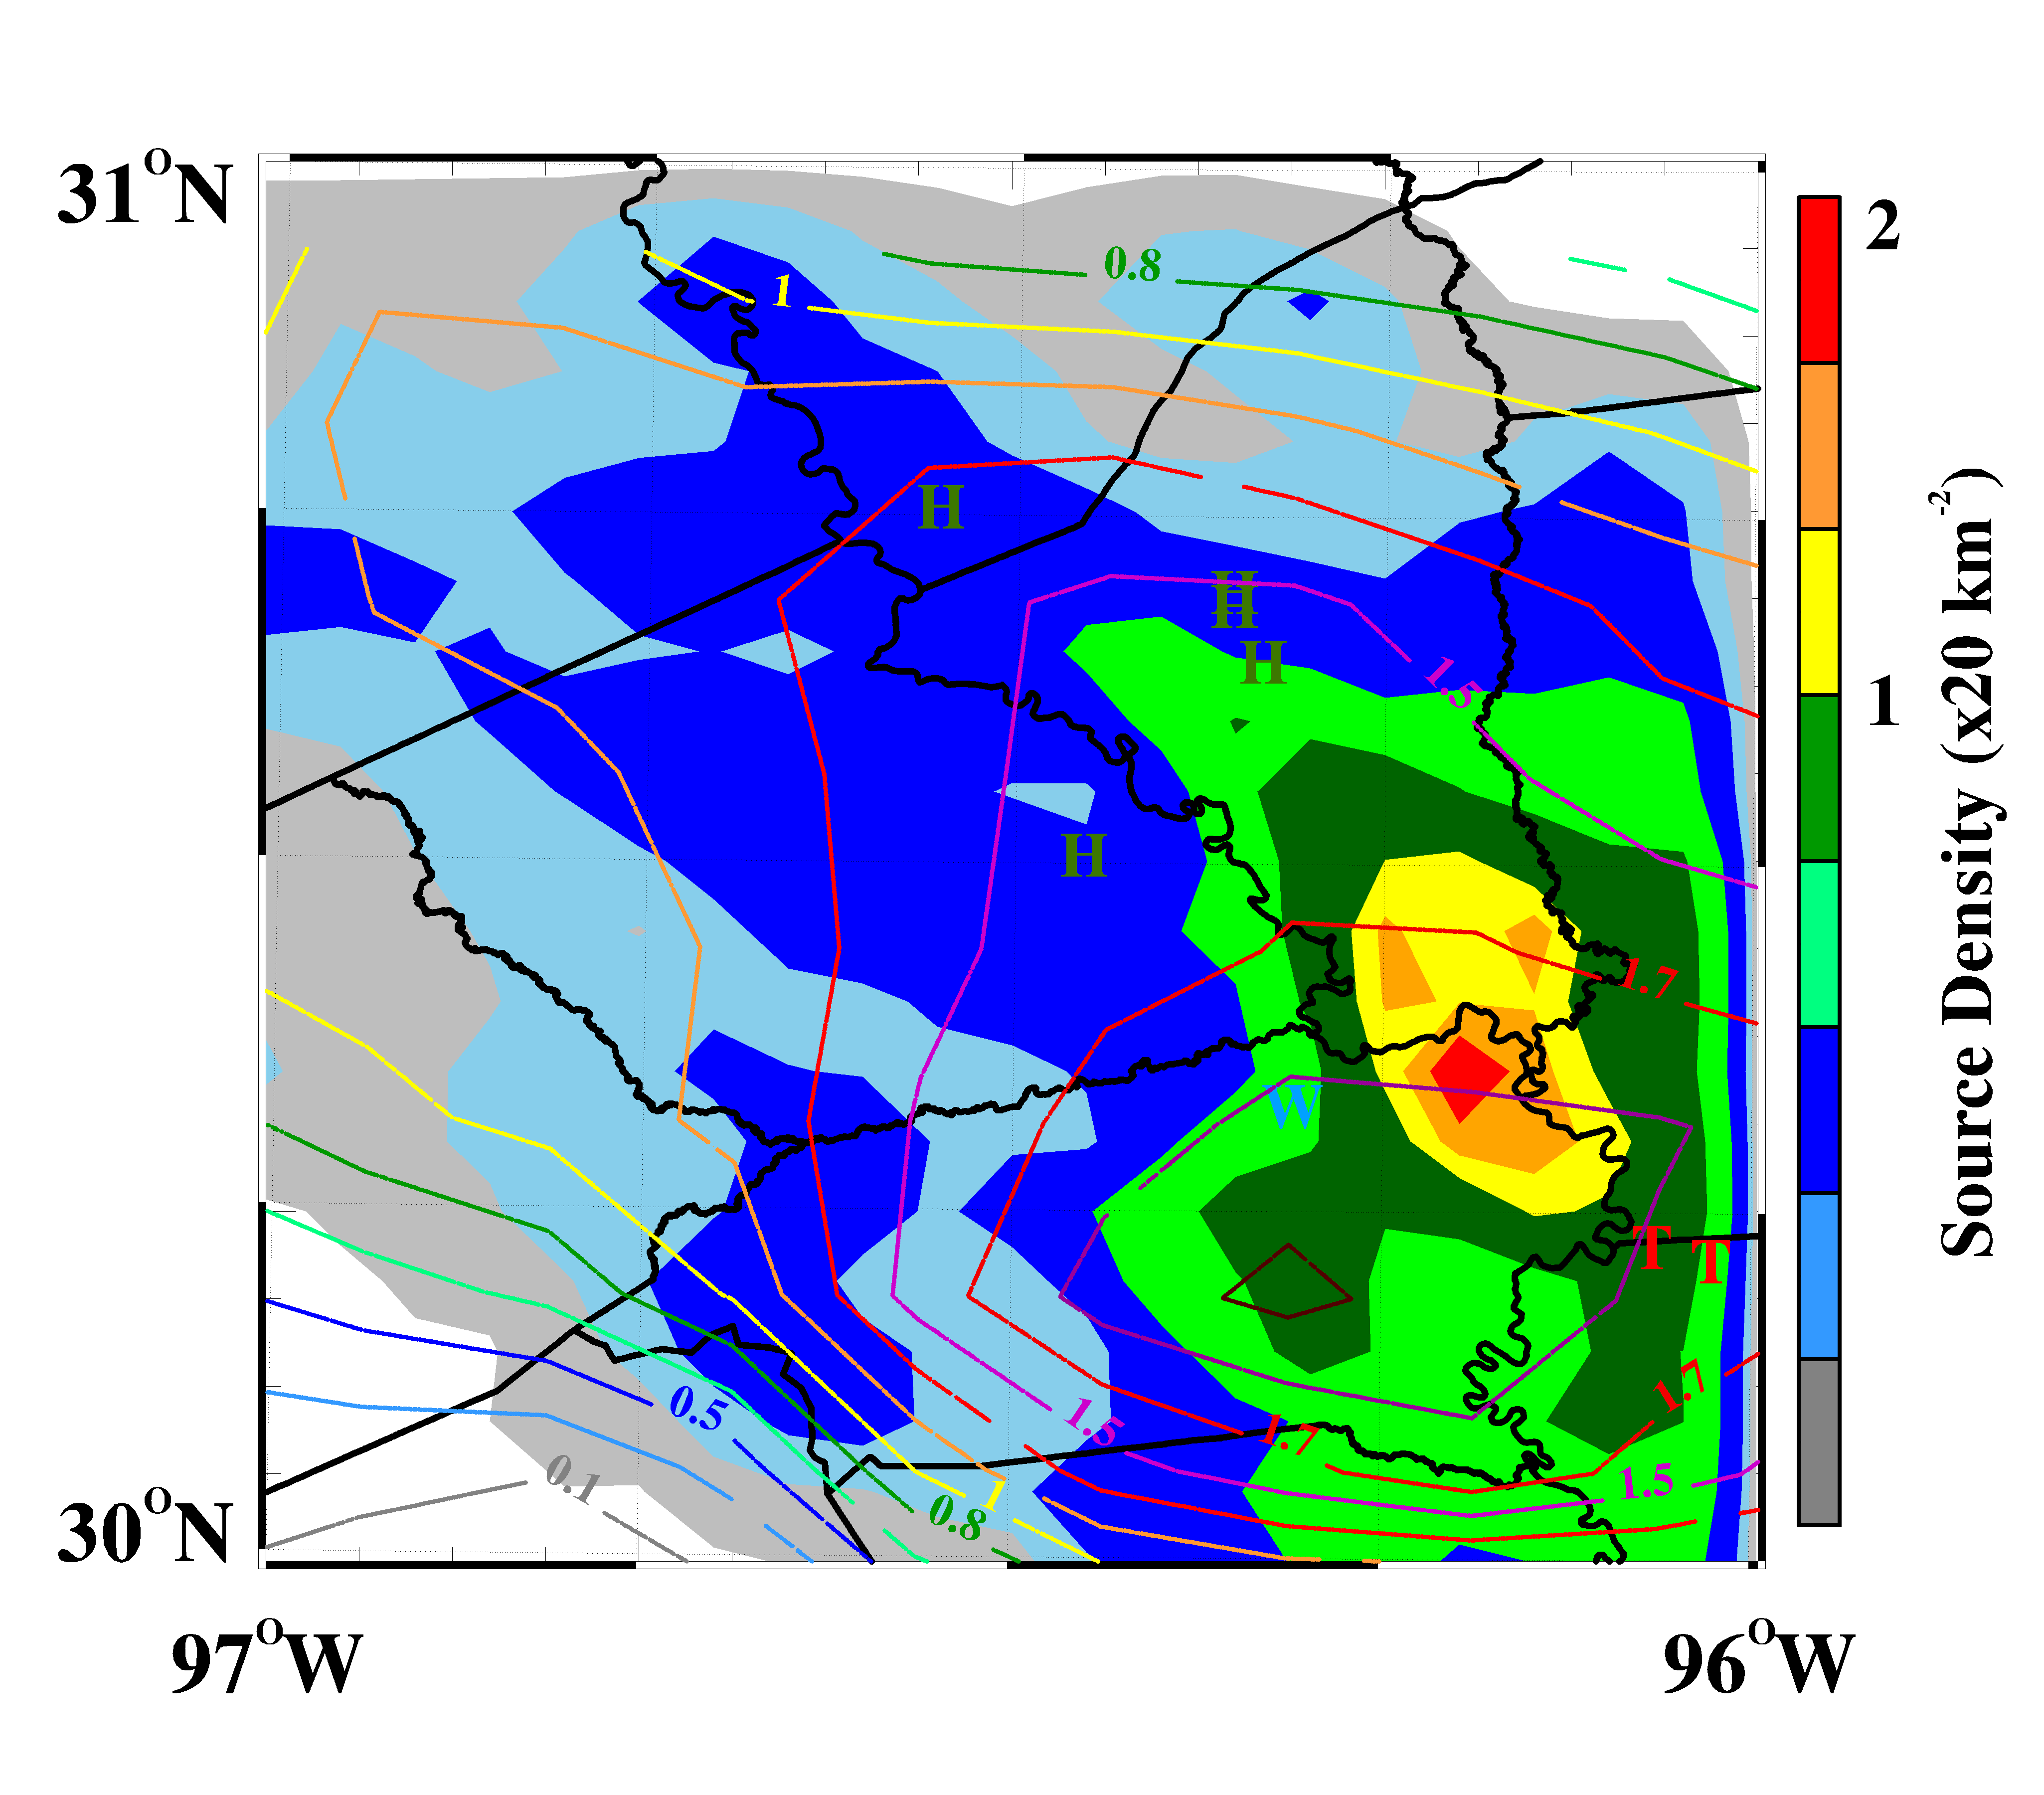
Specific areas of intense lightning activity where severe weather was observed, such as tornadoes (T), severe hail (H), severe wind (W) and heavy rain (color contours).
USES OF DECIMATED DATA
Publicly available HLMA data are posted every minute. The data should never be used as a means for lightning protection. The HLMA can advise when lightning activity may occur in a particular area. When lightning is detected in your area, please adhere to all lightning safety guidelines presented by the National Weather Service. In summary:
- Seek shelter if lightning is observed or thunder is heard.
- Adjust any outdoor plans if lightning activity is ongoing in your area.
- Listen to local media outlets (radio, TV, internet, NOAA weather radio) in any event of inclement weather.
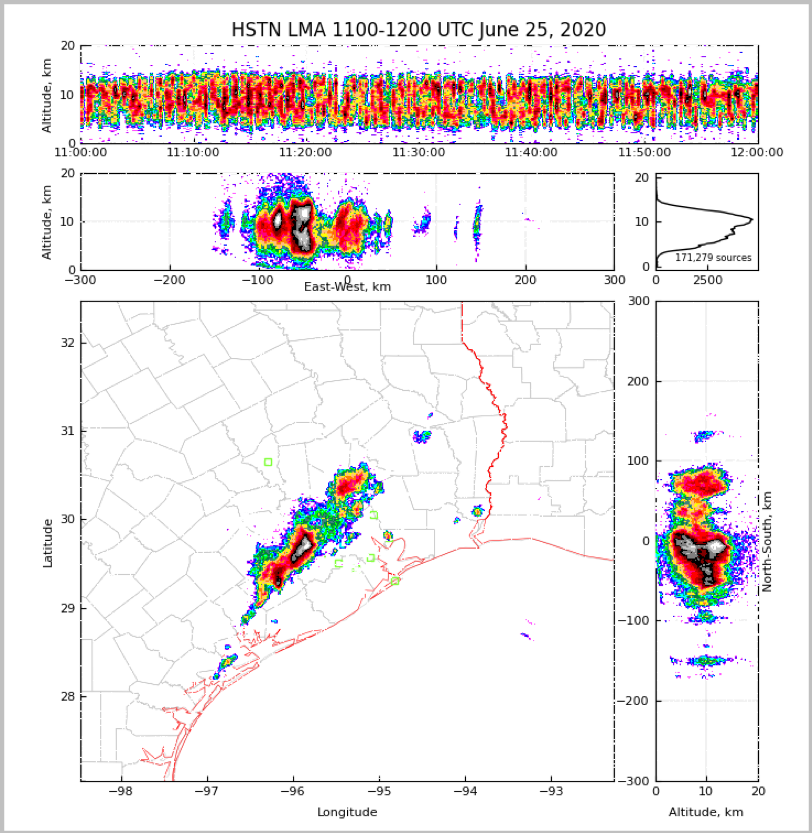
EXAMPLE OF HLMA WEBSITE FIGURE
Top box – Time series of the altitude and density of lightning activity within the past 10 minutes.
- Central Daylight Time is 5 hours behind Universal Coordinated Time (UTC) from the first Sunday in March through the first Sunday in November. CDT is UTC-5.
- Central Standard Time is 6 hours behind UTC time from the first Sunday in November through the first Sunday in March. CDT is UTC-6.
Middle left box – East-west spatial and altitude extent of lightning activity
Middle right box – Frequency of lightning sources at a given height with the number of sources per 10 minutes
Bottom left box – Map view of lightning activity with counties overlain. Green boxes are HLMA sensor locations.
Bottom right box – North-south spatial and altitude extent of lightning activity.
There are three Zoom modes:
- Zoom 1 – Total area of HLMA coverage
- Zoom 2 – Bryan/College Station + Houston Metropolitan Area
- Zoom 3 – Harris County and surrounding areas
*Areas with a high concentration of lightning activity may also be experiencing a high intensity of rainfall and caution should be taken when residing or driving in those areas.
